Walmart Sales Dashboard
Walmart Sales Dashboard
📝 Problem Statement
The goal of this project is to analyze Walmart's sales data to identify trends in profitability and sales performance. By examining the data across different years, product categories, and months, this analysis aims to support data-driven decision making and highlight areas of business strength and opportunity.
🚀 Overview
This project provides an in-depth look at Walmart's sales performance using Power BI, and Figma for data processing, visualization, and design. Key metrics include yearly profit trends, category performance, and monthly sales insights, offering a comprehensive view of the business's financial health. Additionally, DAX (Data Analysis Expressions) is utilized within Power BI to create complex calculations and aggregations.
🛠 Tools Used
-
Power BI: Used for creating interactive dashboards and dynamic visualizations. Advanced calculations and aggregations are implemented using DAX.
-
Figma: Applied for designing the dashboard interface and layout, ensuring a user-friendly and modern design experience.
🔢 Key Insights
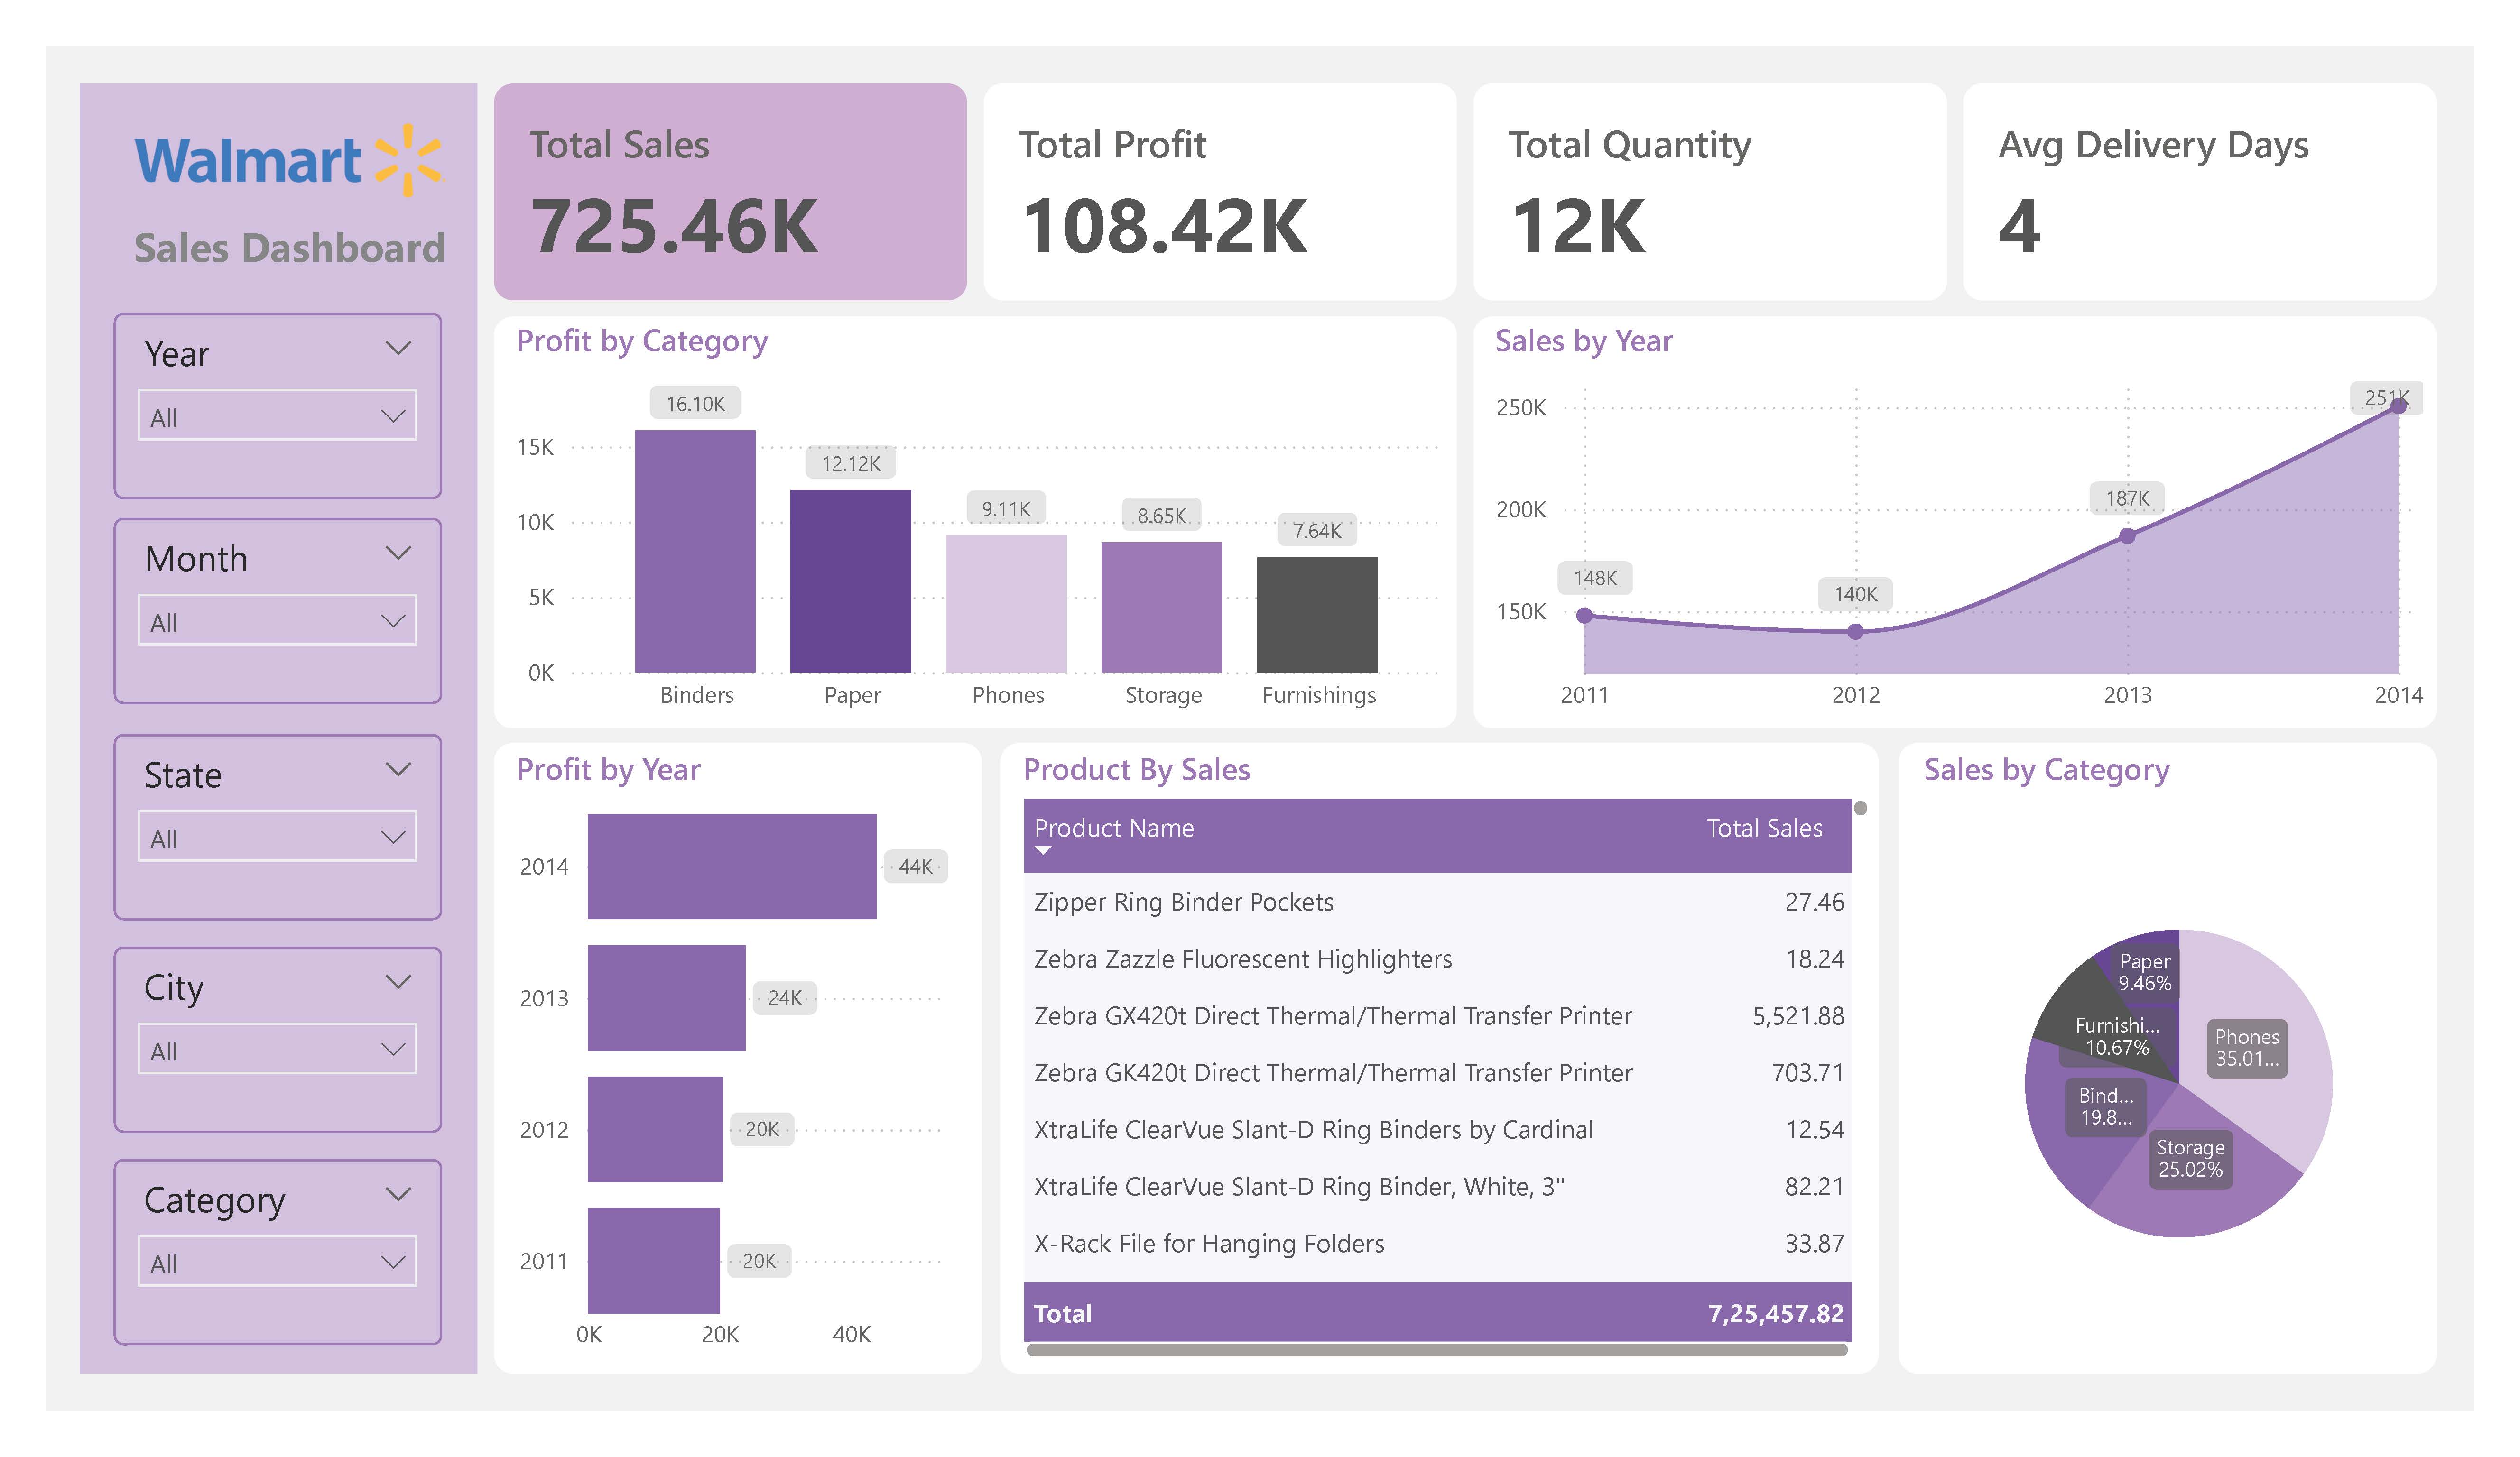
1. Yearly Profit Analysis
- 2014: Highest profitable year with $251k profit out of $725.46k total revenue.
- Comparative Profits by Year:
- 2013: $187k
- 2012: $140k
- 2011: $148k
2. Category Performance
- Highest Profitable Category: Binders with a profit of $16.10k.
- Most Selling Category: Phones, contributing to 35% of total sales.
3. Monthly Performance
- December: Both the highest profitable and highest selling month with a profit of $13.26k out of $725.46k total revenue.